Monitoring my deGiro Portfolio
I was interested in monitoring the growth of my stock portfolio at DeGiro. After googling a bit I learned it was possible to get the data I was interested in using a few simple HTTP GET/POST requests. I got inspired by the Node.JS unofficial API and decided to make my own API using Python. After peering at the network monitor output of the web developer tools for some time I was able to quickly cook up a Pyton based API.
Next step was to add a crontab entry to retreive the current portfolio value every hour during working days and hours:
00 9-17 * * 1-5 bram python3.6 /home/bram/degiro/giro-log.py
For my visualisations I use a combination of Grafana and InfluxDB. Getting data from scripts into InfluxDB is a piece of cake:
# Send data to the InfluxDB
url = 'http://localhost:8086/write?db=degiro'
data = 'pf_summary cash={:.2f},equity={:.2f}'.format(pfs['cash'], pfs['equity'])
res = requests.post(url=url, data=data)
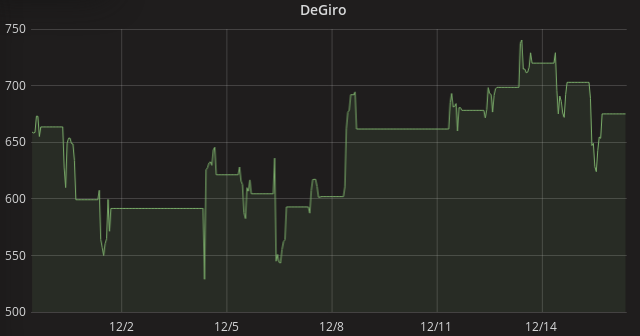
And the final result:
Comments